31 Module 6: The Proof of Concept
Architecture, Implementation, and Results
31.1 §6.1 The PoC Claim and Its Boundaries
The Edendale–Southland proof of concept demonstrates five things and only five things. Before any pipeline, result, or finding is presented, these five claims and their four principal limitations must be read together, because the significance of the results depends entirely on understanding both what they establish and what they do not.
The five demonstrated claims are as follows. First, a decision-centred modelling environment built from the architecture described in Modules 3 and 4 can be implemented at the site-to-region scale using openly available tools and documented data. The implementation is reproducible, the artefacts are schema-conforming, and the analytical pipeline can be re-run from documented inputs to verified outputs. Second, the two-pathway comparison of 2035_EB (Electrified Boiler) and 2035_BB (Biomass Boiler) can be conducted under identical external conditions across a structured future ensemble without requiring iterative feedback between the site and regional modules. Third, the one-pass coupling architecture produces GXP adequacy findings that are invisible from within the site boundary and that materially affect the system-level cost comparison between pathways. Fourth, the site decision robustness overlay can be implemented as a post-processing layer that adds stylised site-cost uncertainty to the grid RDM evaluation without breaking the one-pass coupling architecture, enabling non-trivial robustness analysis of the pathway decision. Fifth, the artefact governance chain produces findings that are fully traceable from the DecisionSummaryArtefact through the ResultArtefacts, SignalsPacks, FutureArtefacts, and DemandPacks that generated them.
The four principal limitations are declared here as first-class claims, not as qualifications appended to favourable results.
The first limitation is one-pass coupling. The current implementation does not iterate between the site dispatch module and the regional screening module. The site dispatch produces the incremental electricity signal; the regional screening evaluates grid constraints; results are aggregated without feedback. A higher-fidelity coupling would pass the upgrade cost adder back to the site dispatch module as a tariff signal and re-run the dispatch under the revised tariff. The one-pass architecture means that the current site-cost estimates do not reflect the full infrastructure-conditional cost in the manner that the system-level regret derivation of Sub-Module SM-4.4-A specifies. Section §6.10 documents the refinement step that would close this gap.
The second limitation is proportional dispatch. The site dispatch module allocates heat demand across utility assets in proportion to their nameplate capacity, without LP-based scheduling or unit-commitment optimisation. Proportional dispatch preserves the temporal structure of the demand profile and produces correct annual fuel and electricity totals, but it does not minimise cost or respect minimum up-time and start-up cost structures. Its effect is to somewhat overstate the site operating cost for pathways with higher-flexibility assets and to somewhat understate it for pathways with fewer flexible options, but to produce the same qualitative pathway comparison ranking as a scheduling-grade dispatch in most futures.
The third limitation is stylised regional screening. The regional adequacy assessment uses a simplified headroom model derived from the RETA Southland assessment rather than a full PyPSA network optimisation. The stylised model evaluates the incremental electricity demand against a declared headroom time series scaled by the future’s headroom multiplier and selects from a discrete upgrade option menu when the headroom is exceeded. It does not represent nodal network flows, voltage constraints, or the intra-day dispatch economics of the regional grid. Its outputs are estimates of infrastructure class and upgrade cost, not optimised network operation results.
The fourth limitation is synthetic demand profiles. The DemandPacks used in the proof of concept are synthetic profiles constructed from the site’s known operating characteristics, seasonal patterns, and RETA calibration targets, not measured operational data from the facility’s energy management system. The construction methodology is documented in Sub-Module SM-6.3-B and the profiles pass the acceptance gate criteria described in §3.6, but they represent plausible demand behaviour rather than recorded demand history.
These four limitations do not invalidate the five demonstrated claims. They bound them. A reader who understands all four is in a position to assess which of the framework’s architectural arguments the proof of concept validates and which require the next-phase developments to test more fully.
31.2 §6.2 Repository Architecture and Run Conventions
The proof of concept is implemented across two code repositories that instantiate the thin-waist two-repository architecture described in §3.4. The site model repository contains the demand construction module, the site dispatch module, the regional screening module, the RDM evaluation scripts, the site decision robustness overlay, and the Snakemake orchestration configuration. The Edendale GXP repository is a standalone module that generates the GXP-level SignalsPack signals, hourly headroom, tariff, and grid emissions intensity data, for the Edendale GXP across all planning epochs under the declared interface contract.
The two repositories communicate through the thin-waist interface contract: the site model repository consumes the SignalsPack files produced by the Edendale GXP repository as governed artefacts under schema version 0.1.0 with SHA256 hash integrity. The Edendale GXP repository can be upgraded or replaced entirely provided the output files continue to conform to schema version 0.1.0. No changes to the site model repository are required unless the interface contract itself is revised.
All outputs within the site model repository are organised under a bundle-level folder structure. A bundle is a named, timestamped run collection that contains all dispatch summaries, incremental electricity traces, regional screening outputs, RDM summaries, robustness overlay outputs, and governance artefacts for a given execution of the full pipeline. Bundle identifiers follow the convention poc_YYYYMMDD_release## to provide both date-stamp and sequential release traceability. Within a bundle, outputs are organised by epoch tag and then by module:
Output/runs/<bundle>/
├── epoch2025/dispatch_prop_v2_capfix1/
├── epoch2028/dispatch_prop_v2_capfix1/
├── epoch2035_EB/dispatch_prop_v2_capfix1/
├── epoch2035_BB/dispatch_prop_v2_capfix1/
├── compare/
├── rdm/
└── _archive_overlays/
The epoch tags 2025, 2028, 2035_EB, and 2035_BB identify the planning horizon and pathway configuration of each run. The dispatch run identifier dispatch_prop_v2_capfix1 encodes the dispatch mode version and the capacity configuration applied, providing the lineage link from output artefacts to the module version and configuration that produced them.
The module sequencing within a bundle execution is strictly one-pass: DemandPack construction precedes site dispatch, site dispatch produces the incremental electricity traces that feed the regional screening, regional screening produces the RDM summaries that the site decision robustness overlay consumes, and the overlay produces the DecisionSummaryArtefacts. No module in this sequence has a feedback path to any earlier module. The full pipeline commands and their arguments are documented in Sub-Module SM-6.2-A.
PoC Pipeline: Commands and Run-Bundle Conventions — complete module execution sequence, PowerShell commands, input/output path conventions, and acceptance checklist — is in SM-6.2-A. Process when replicating or extending the pipeline.
31.3 §6.3 Demand Representation and DemandPack Construction
The DemandPacks for the Edendale proof of concept cover five planning epochs: 2025 (baseline current operations), 2028 (near-term transition planning horizon), 2035_EB (full electrification pathway), and 2035_BB (full biomass pathway). Each DemandPack is a schema-conforming governed artefact carrying an hourly heat demand profile, annual summary statistics, and full provenance linking it to the generating run and the future conditions under which it was constructed.
The construction methodology is synthetic: demand profiles are constructed from the facility’s known operating characteristics, seasonal patterns from publicly available data, and RETA-calibrated annual totals, rather than from measured energy management system data. The synthetic methodology is appropriate for a methodological proof of concept where the objective is to demonstrate analytical architecture rather than to produce a planning-grade forecast for a specific facility. The profiles are designed to be representative rather than exact: they capture the seasonal concentration of dairy processing heat demand in the winter milk processing season, the diurnal pattern that reflects processing schedules and steam system thermal inertia, and the annual totals that are consistent with published RETA estimates of the facility’s process heat demand.
The five epoch configurations differ in their annual demand levels, their pathway-specific technology assumptions, and the presence or absence of an incremental electricity load. The 2025 and 2028 epochs represent the coal-fired baseline with evolving operating intensity. The 2035_EB epoch represents the facility operating under full electrification, with the steam boilers replaced by electric boilers whose demand profile reflects the same seasonal and diurnal pattern but delivered through electricity rather than coal combustion. The 2035_BB epoch represents the facility operating under full biomass conversion, with the coal boilers replaced by biomass boilers whose demand profile is essentially identical to 2035_EB in temporal structure but served by biomass rather than electricity.
The critical distinction between 2035_EB and 2035_BB in the context of the GXP adequacy assessment is not the heat demand profile, which is nearly identical, but the electricity interface signal. The 2035_EB epoch generates a large incremental electricity demand at the GXP boundary; the 2035_BB epoch does not. This asymmetry is what makes the GXP adequacy assessment decision-relevant for the pathway comparison and is what generates the 100-future grid upgrade finding documented in §6.9.
The DemandPack rounding error incident described in §3.6 occurred during the 2035_EB construction. The acceptance gate identified three provisional DemandPacks whose annual totals were 0.7 to 0.9 percent below the declared annual total, exceeding the 0.5 percent closure tolerance. The gate produced failed ValidationArtefacts for all three, the algorithm was corrected, and replacement DemandPacks were produced and published. The failed artefacts were retained in the backbone as governance records. Sub-Module SM-6.3-B provides the full technical specification of the construction methodology.
DemandPack Generation Methods: Technical Specification — construction algorithm, seasonal decomposition, calibration targets, and stochastic variability specification — is in SM-6.3-B. Process when validating or reproducing the DemandPack construction.
31.4 §6.4 Site Dispatch and Pathway Configurations
The site dispatch module allocates hourly heat demand across the utility assets declared in the pathway configuration and computes the resulting fuel consumption, electricity consumption, emissions, and cost for each unit and for the site total. Two dispatch modes are implemented: proportional mode and optimal-subset mode.
Proportional dispatch allocates heat demand to each committed unit in proportion to its nameplate thermal capacity. If a unit’s allocation would exceed its rated output, the excess is redistributed to other units or, if no other capacity is available, recorded as unserved heat demand. The proportional mode does not account for unit-specific marginal costs, minimum output constraints, or start-up costs. It is the current mode used in all proof-of-concept results reported in §6.9.
Optimal-subset dispatch uses a unit-commitment-lite logic that evaluates all possible combinations of committed units within a declared commitment block (weekly blocks of 168 hours in the current configuration) and selects the combination that minimises total cost over the block subject to minimum output and capacity feasibility constraints. For each committed subset, the algorithm computes fuel cost, electricity cost, variable operation and maintenance cost, fixed operating cost for committed units, and start-up cost for units that are newly committed in the block. Optimal-subset mode is implemented and passes its acceptance gate but was not used for the thesis results presented in §6.9 because the pathway comparison qualitative findings are consistent between modes and the proportional dispatch is the declared limitation of the current PoC.
The utility asset configurations for the two 2035 pathways differ in the technology types assigned to the boiler slots. The 2035_EB configuration assigns electric boiler units to the primary steam generation slots, with a small gas-fired backup unit retained for reliability purposes. The electric boilers draw electricity from the grid at the prevailing tariff, with electricity consumption computed from the heat output divided by the declared conversion efficiency. The 2035_BB configuration assigns biomass boiler units to the same primary steam generation slots, with fuel consumption computed from the heat output divided by the boiler’s declared thermal efficiency and the biomass fuel’s declared calorific value. The annual cost computation applies the biomass delivered price from the pathway configuration artefact and the prevailing ETS price to biomass combustion at the pathway’s declared emissions factor.
For the electricity cost computation in 2035_EB, the module computes the annual electricity cost as the product of annual electricity consumption and the average tariff declared in the SignalsPack. In futures where the regional screening module has assigned an upgrade-class tariff adder, the effective tariff includes that adder. The tariff adder mechanism is the pathway through which the regional infrastructure cost partially enters the site cost assessment, subject to the declared one-pass coupling limitation.
Sub-Module SM-6.4-C provides the complete interface contract tables, including all schema fields for the SiteConfigArtefact, the dispatch output ResultArtefact, and the IncrementalElectricityPack.
Site Module Interface Contract and Schema Tables — SiteConfigArtefact, ResultArtefact, and IncrementalElectricityPack schema tables — is in SM-6.4-C. Process when implementing or verifying site module compliance.
31.5 §6.5 The SignalsPack Generator and GXP Interface
The Edendale GXP repository is the proof of concept’s concrete instantiation of the thin-waist principle at the codebase level. It is a standalone repository maintained independently of the site model repository that generates the SignalsPack files consumed by the site dispatch module and the regional screening module. Its outputs, hourly GXP capacity, baseline import, reserve margin, headroom, and tariff data for the Edendale GXP across planning epochs 2020, 2025, 2028, and 2035, are produced under a frozen interface contract and verified by SHA256 hash integrity before consumption.
The frozen schema version 0.1.0 specifies the exact column names, data types, temporal resolution, and file naming conventions of every output file. The SHA256 hash of each output file is stored in a provenance JSON record alongside the file, and the consuming modules verify this hash before loading any SignalsPack data. If the hash verification fails, the pipeline halts and the mismatch is logged as a failed ValidationArtefact. This mechanism ensures that any corruption, inadvertent modification, or version mismatch in the SignalsPack files is detected before the data enters the analytical chain.
The signals manifest, stored as signals_manifest.toml in the Edendale GXP repository, records the file name, epoch, schema version, SHA256 hash, and generation date for every output file. The manifest serves as the interface contract’s physical implementation: a consuming module that reads the manifest can verify, before opening any data file, that the available files conform to the declared schema version and that their integrity has not been compromised. Sub-Module SM-6.5-D provides the full interface contract specification including all column definitions, file naming conventions, and the manifest schema.
SignalsPack Generator Repository: Interface Contract v0.1.0 — column definitions, file naming, manifest schema, hash integrity protocol — is in SM-6.5-D. Process when verifying SignalsPack integrity or planning a module upgrade.
31.6 §6.6 Regional Screening and Grid RDM Evaluation
The regional screening module receives the IncrementalElectricityPack for each pathway and epoch, reads the corresponding SignalsPack, and evaluates whether the incremental electricity demand exceeds the available GXP headroom under each of the 100 paired futures. For each future, the module multiplies the baseline headroom time series by the future’s headroom multiplier and compares the resulting adjusted headroom to the incremental electricity demand hour by hour.
When the incremental demand exceeds the adjusted headroom in any hour, a binding constraint event is recorded. The module then evaluates each upgrade option from the declared upgrade menu, computing for each option the total annual cost as the sum of the annualised upgrade capital cost and the annualised shed cost. The annualised upgrade cost is computed as the capital cost multiplied by the future’s upgrade capex multiplier and the consents uplift multiplier, divided by the annualisation factor derived from a declared capital recovery factor. The shed cost is computed as the annual unserved energy under that upgrade option multiplied by the future’s VOLL value.
The upgrade option that minimises total annual cost is selected for that future, and the result is written to the RDM summary CSV as a single row containing the future identifier, the selected upgrade name, the selected additional capacity, the annualised upgrade cost, the annual incremental energy, the annual shed energy, the shed fraction, the shed cost, the total cost, the number of binding hours, and the peak unserved demand.
This process is repeated for all 100 futures and for both the 2035_EB and 2035_BB incremental electricity signals. The resulting two RDM summary CSVs, one per pathway, share identical future_id sets because both were evaluated against the same futures_2035.csv template. The paired structure is what makes the future-by-future pathway comparison in the site decision robustness overlay valid.
The specification for the next-phase PyPSA regional module, which would replace the stylised screening model with a full network optimisation producing governed SignalsPack outputs through the same interface contract, is in Sub-Module SM-6.6-E.
PyPSA Regional Module Design: Next-Phase Specification — network structure, optimisation formulation, SignalsPack output mapping, and surrogate development pathway — is in SM-6.6-E. Process when planning or implementing the PyPSA regional module.
31.7 §6.7 The Site Decision Robustness Overlay
The site decision robustness overlay is a post-processing module that consolidates the site dispatch cost summaries with the grid RDM summaries to produce a pathway comparison that reflects uncertainty in both the site-level cost components and the regional infrastructure conditions. It is a post-processing overlay only: it reads existing dispatch summaries and RDM summaries, applies stylised uncertainty multipliers to site cost components, and computes future-specific system costs and robustness metrics. It does not re-run dispatch, modify existing artefacts, or introduce any feedback between modules.
The overlay’s design addresses the one-pass coupling limitation identified in §6.1. Because the one-pass pipeline does not iterate the tariff signal from the regional screening back to the site dispatch, the site cost estimates in the ResultArtefacts do not fully reflect the infrastructure-conditional costs in futures where a grid upgrade is required. The overlay partially corrects for this by computing the future-specific system cost as the sum of the baseline site cost and the annualised upgrade cost from the RDM summary, scaled by the future’s site-cost multipliers for electricity price, biomass price, and ETS. This combined cost is the input to the robustness metrics computation.
Three site-cost multiplier dimensions are applied. The electricity price multiplier (P_elec_mult) scales the electricity cost component of the EB pathway cost, reflecting uncertainty in the wholesale electricity price trajectory over the asset’s operating life. The biomass price multiplier (P_biomass_mult) scales the fuel cost component of the BB pathway cost, reflecting uncertainty in delivered biomass price due to supply chain competition and logistics development. The ETS multiplier (ETS_mult) scales the carbon cost component of both pathways in futures where direct combustion emissions exist, reflecting the policy uncertainty documented in Module 5 §5.4. These multipliers are applied to the baseline site cost components drawn from the dispatch summary, not to the full system cost, ensuring that the grid upgrade cost from the RDM summary is not inadvertently scaled.
Multiplier values for each future are drawn from triangular distributions with declared ranges and modes, using a fixed random seed of 42 for reproducibility. The multiplier ranges are calibrated to the NZ-specific uncertainty ranges documented in Module 5 §5.6. Multiplier values are stored in the canonical futures.csv per-bundle alongside the grid RDM driver values, ensuring that the full future specification is recoverable from a single file.
The overlay produces four output artefacts: a per-future joined table with baseline and future-costed system costs for both pathways; a summary metrics CSV carrying win rates, regret statistics, and satisficing rates; a regret CDF comparison figure; and a system cost distribution boxplot figure. The summary metrics are the primary inputs to the results presentation in §6.9.
31.8 §6.8 Validation and Artefact Integrity
Every artefact in the proof-of-concept release bundle passed its declared acceptance gates before being admitted to the comparison chain, with one documented exception that was identified, corrected, and retained in the governance record. The exception is the DemandPack rounding error incident described in §3.6: three provisional DemandPacks for the 2035_EB epoch failed the energy balance closure gate, were corrected, and were superseded by validated replacements. The failed ValidationArtefacts are retained in the bundle alongside their associated failed DemandPacks as permanent governance records.
All other artefacts passed their acceptance gates on first submission. The SignalsPack files produced by the Edendale GXP repository passed SHA256 hash verification on all consuming module reads. All RDM summary CSVs were verified against the paired-futures contract: the EB and BB summaries contain identical future_id sets sourced from the same futures_2035.csv template. The site decision robustness overlay passed the validate-only check before generating outputs. The pathway comparison markdown and CSV were generated from the TOTAL row of the validated dispatch summaries.
The lineage chain for the primary findings in §6.9 can be traced as follows. The DecisionSummaryArtefact carrying the 100-future grid upgrade and robustness findings references the site_decision_robustness_summary_2035.csv overlay output. That overlay output references the rdm_summary_2035_EB.csv and rdm_summary_2035_BB.csv RDM summaries. Each RDM summary row references the future identifier from futures.csv and the incremental electricity trace from signals/incremental_electricity_MW_2035_EB.csv. That trace references the site dispatch summary, which references the DemandPack artefact identifier. The DemandPack artefact identifier references the generating run and the epoch configuration. The complete chain is recoverable from the run-bundle folder structure and the SHA256 hash records.
Sub-Module SM-6.8-F provides the full per-artefact validation log and the lineage statistics for the release bundle.
Validation Records and Artefact Log — per-artefact acceptance gate outcomes, failure-correction log, and lineage statistics — is in SM-6.8-F. Process when auditing the PoC or verifying governance completeness.
31.9 §6.9 Results: What the Demonstration Establishes
The proof of concept establishes five findings from the 100-future paired ensemble. Each is stated in terms of the boundary declarations of §6.1 and is traceable to the artefact chain documented in §6.8.
Finding 1: The grid upgrade finding.
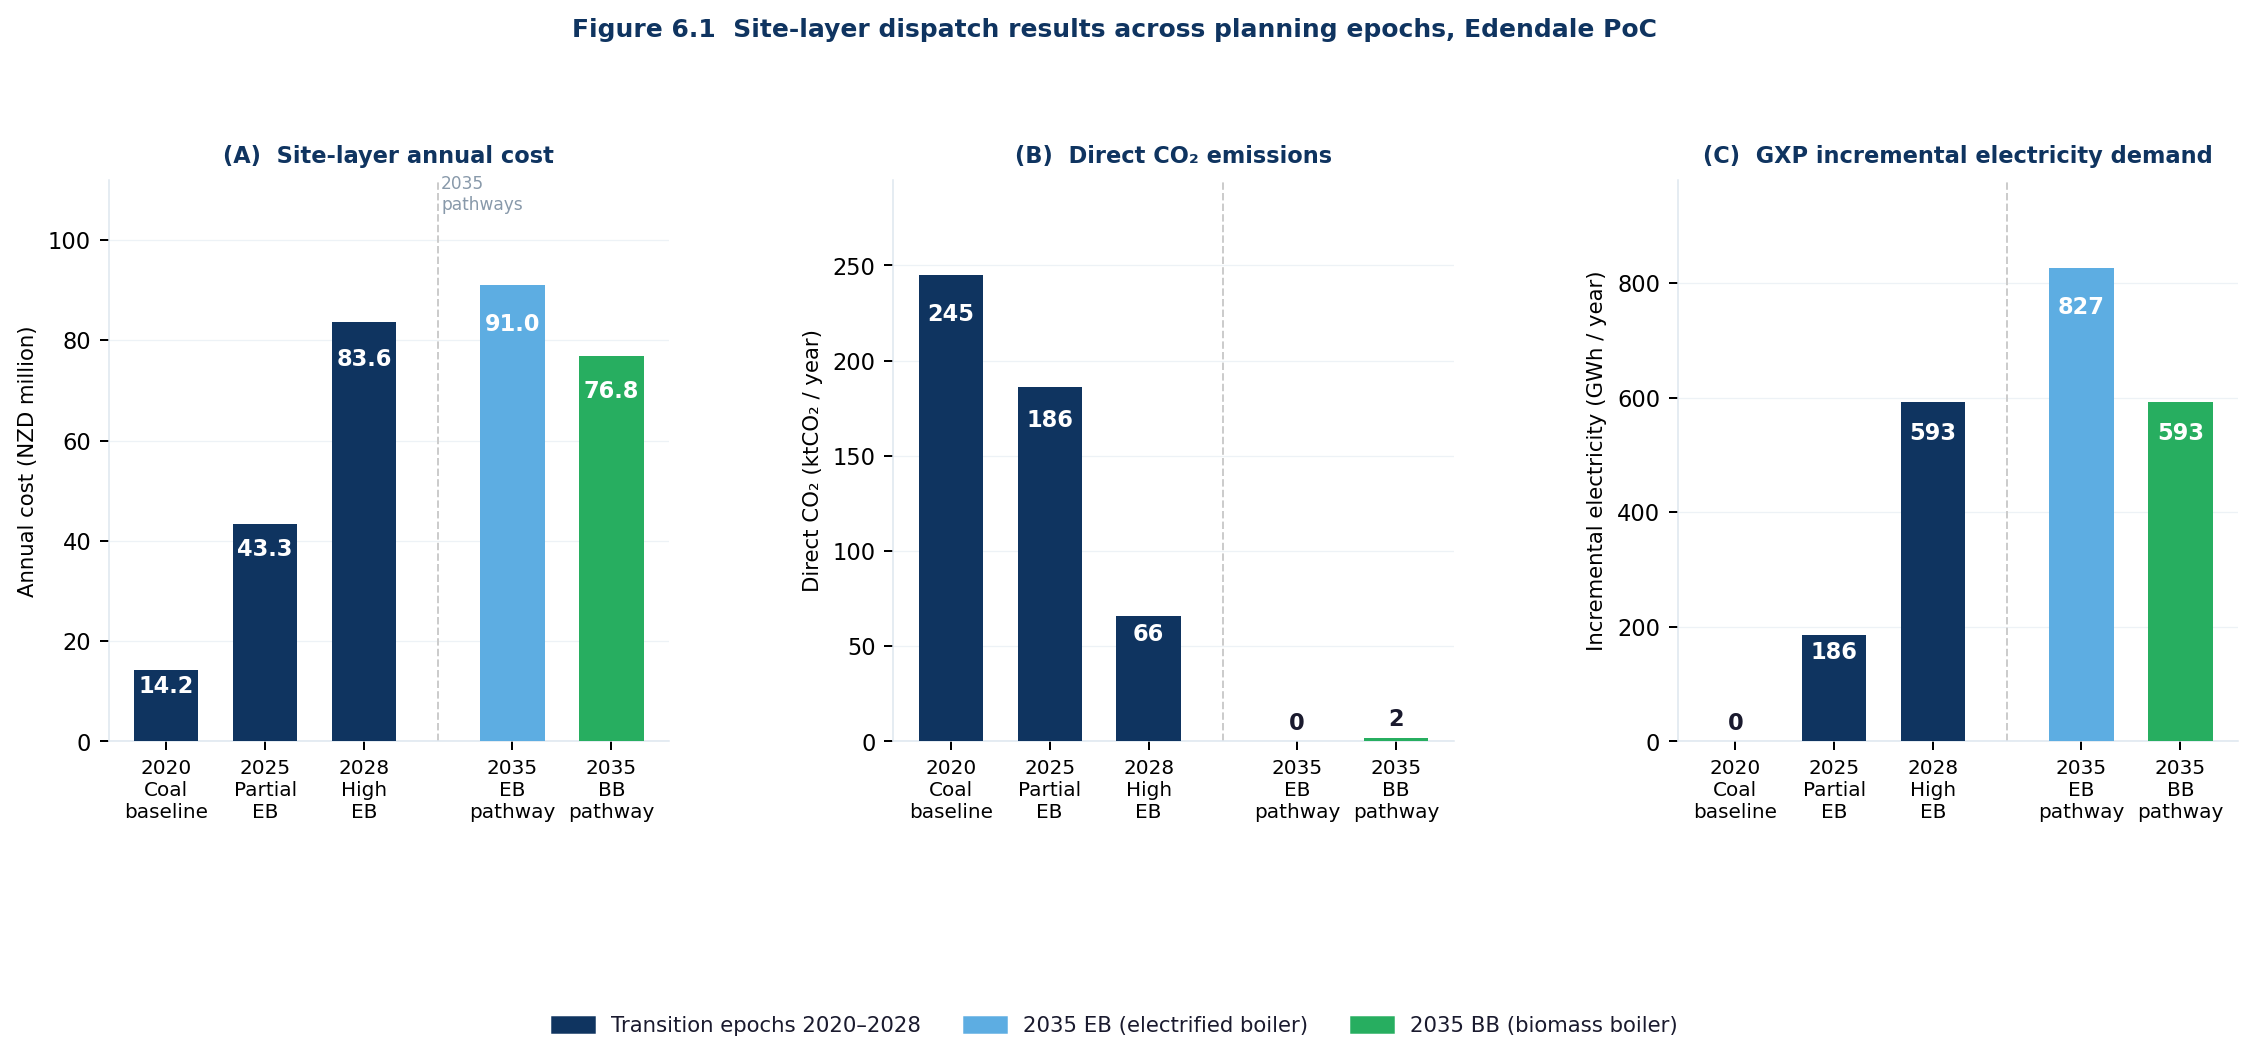
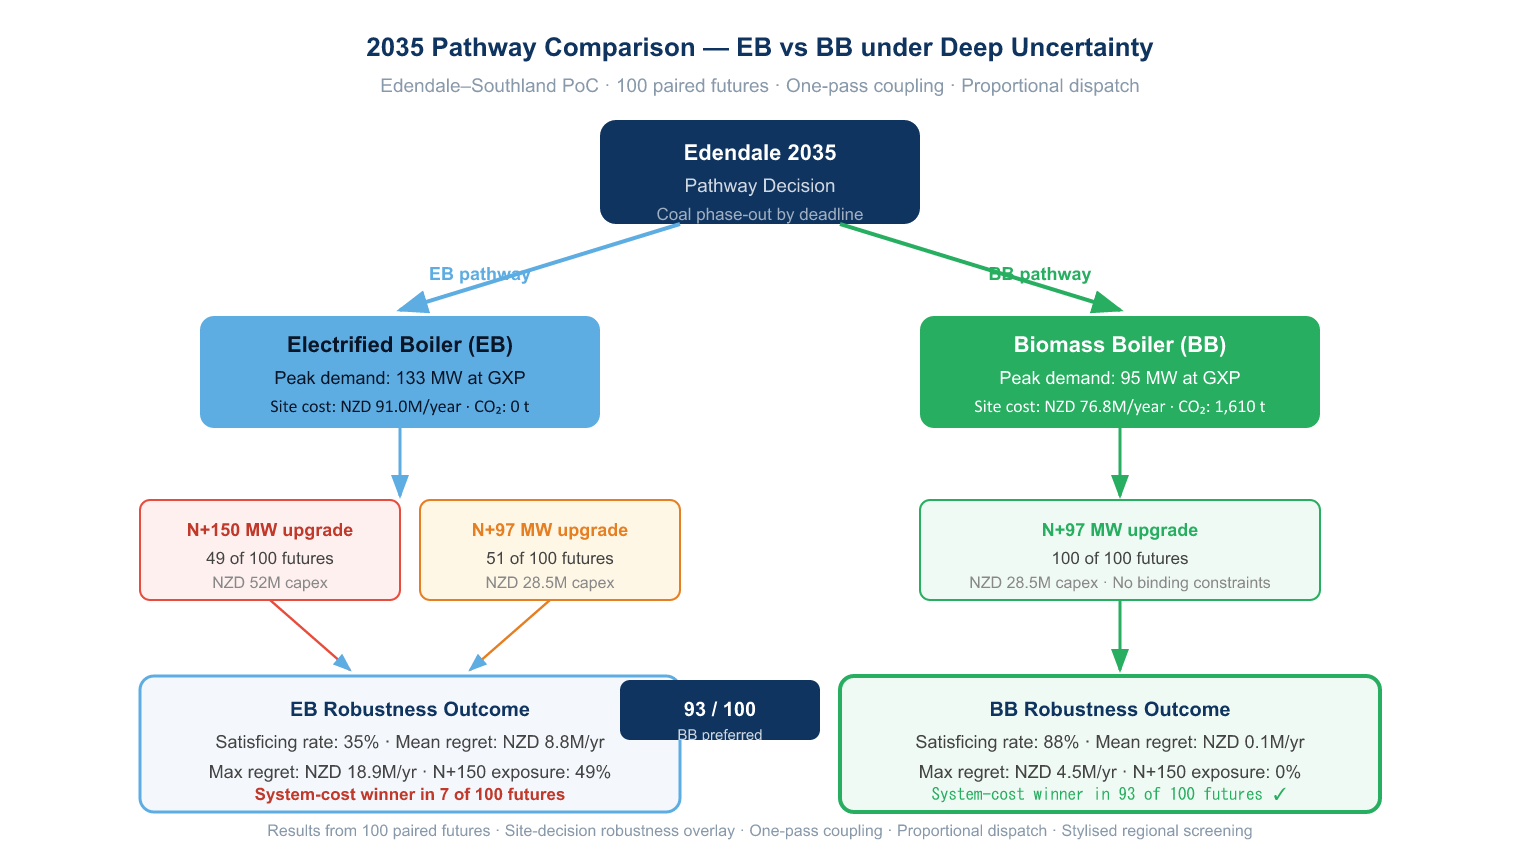
All four planning epochs deliver the same 819 GWh of annual heat demand. Direct CO₂ emissions fall from 244,703 tCO₂ in 2020 to zero under the EB pathway and to 1,610 tCO₂ under the BB pathway in 2035. The site annual cost rises from NZD 14.2M in 2020 to NZD 91.0M (EB) and NZD 76.8M (BB) in 2035, reflecting the higher electricity tariff under full electrification. BB therefore offers a NZD 14.2M/year private cost advantage over EB at the site level under baseline conditions.
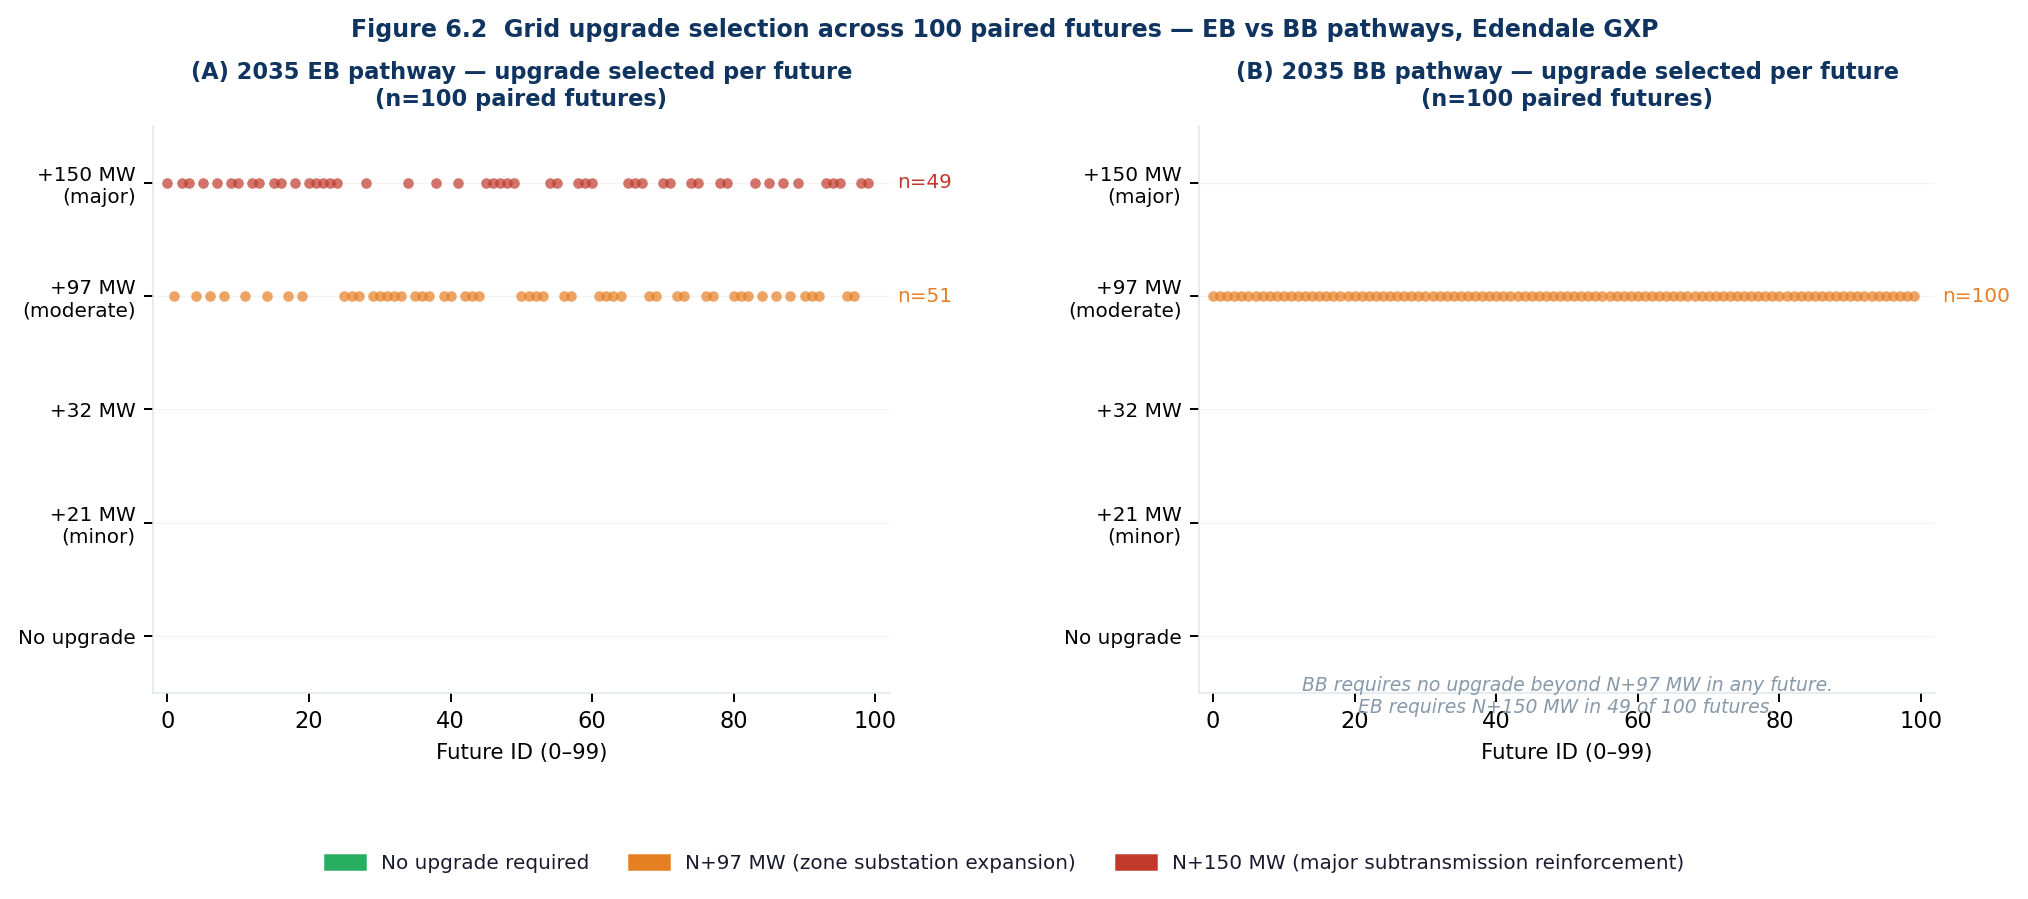
Under the regional screening model with the 100-future paired ensemble, the EB pathway requires a grid upgrade in every future without exception. In 51 of 100 futures the required upgrade is N+97 MW (zone substation expansion, NZD 28.5M capex); in the remaining 49 of 100 futures a major N+150 MW reinforcement (NZD 52.0M capex) is required. The BB pathway requires the N+97 MW upgrade in all 100 futures but never triggers the N+150 MW class. The distinction is not whether a grid upgrade is needed — both pathways require one in every future — but whether the EB pathway’s higher incremental peak demand (133 MW vs 95 MW) forces the costlier upgrade class in a given future. Twenty-four of the 100 futures produce binding hourly headroom constraints under EB, with a maximum shed event of 181.9 MWh.
Finding 2: The robustness analysis.
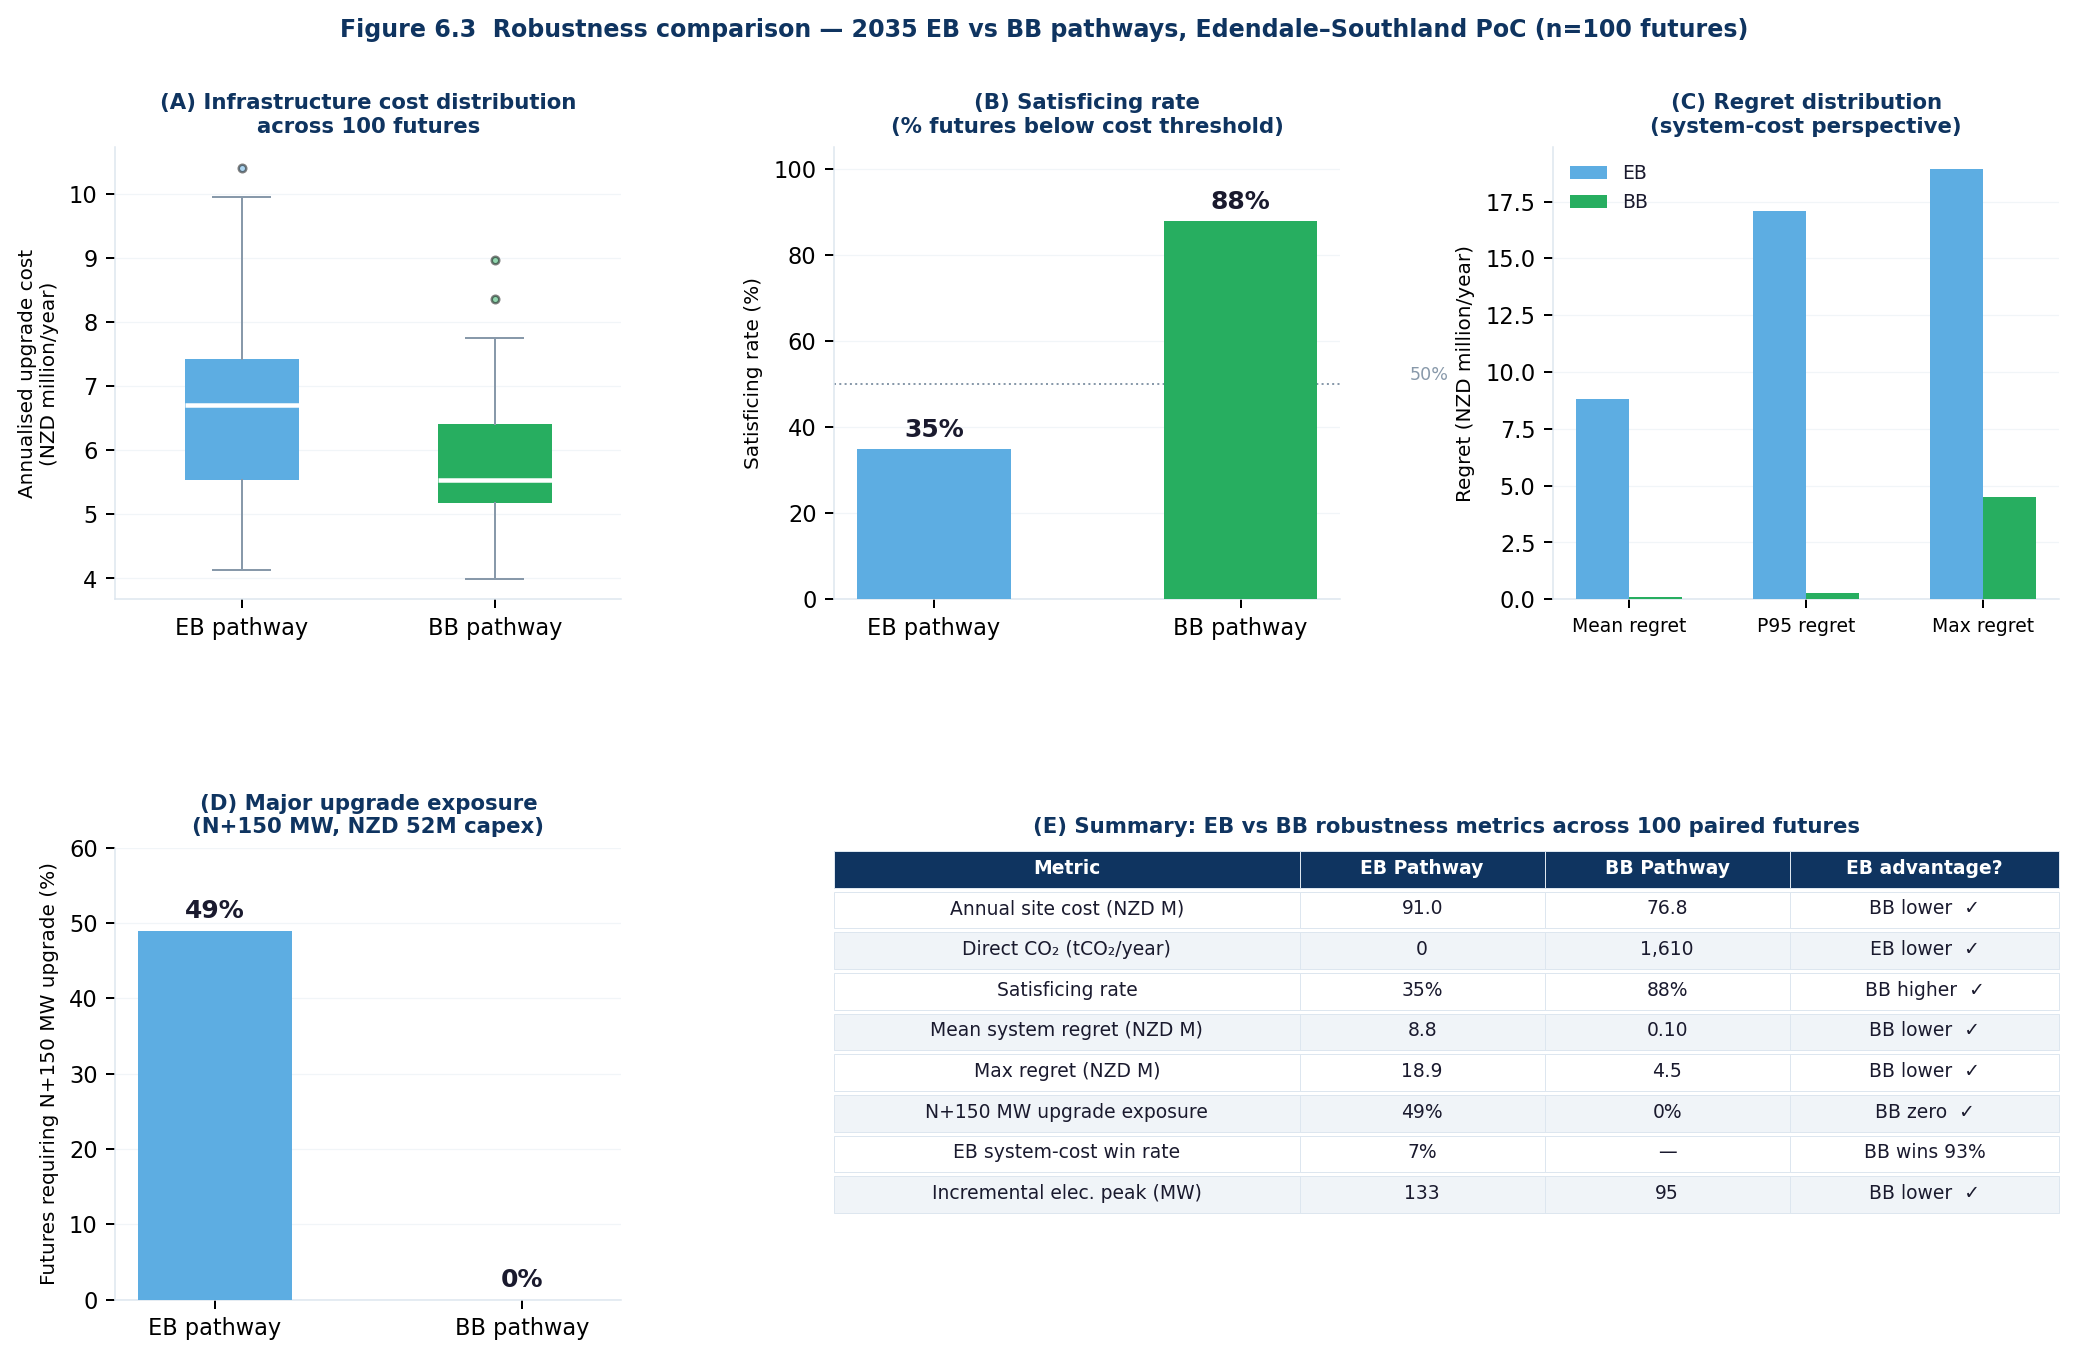
Under the site decision robustness overlay, BB achieves an 88% satisficing rate against the declared cost threshold, compared with 35% for EB. BB wins on system cost in 93 of 100 futures. EB’s mean system-level regret is NZD 8.8M/year; BB’s mean regret is NZD 0.1M/year. EB’s maximum regret reaches NZD 18.9M/year, compared with NZD 4.5M/year for BB. EB carries a 49% exposure to the N+150 MW upgrade class; BB carries zero exposure to that class in any future.
Finding 3: The system-level cost divergence.
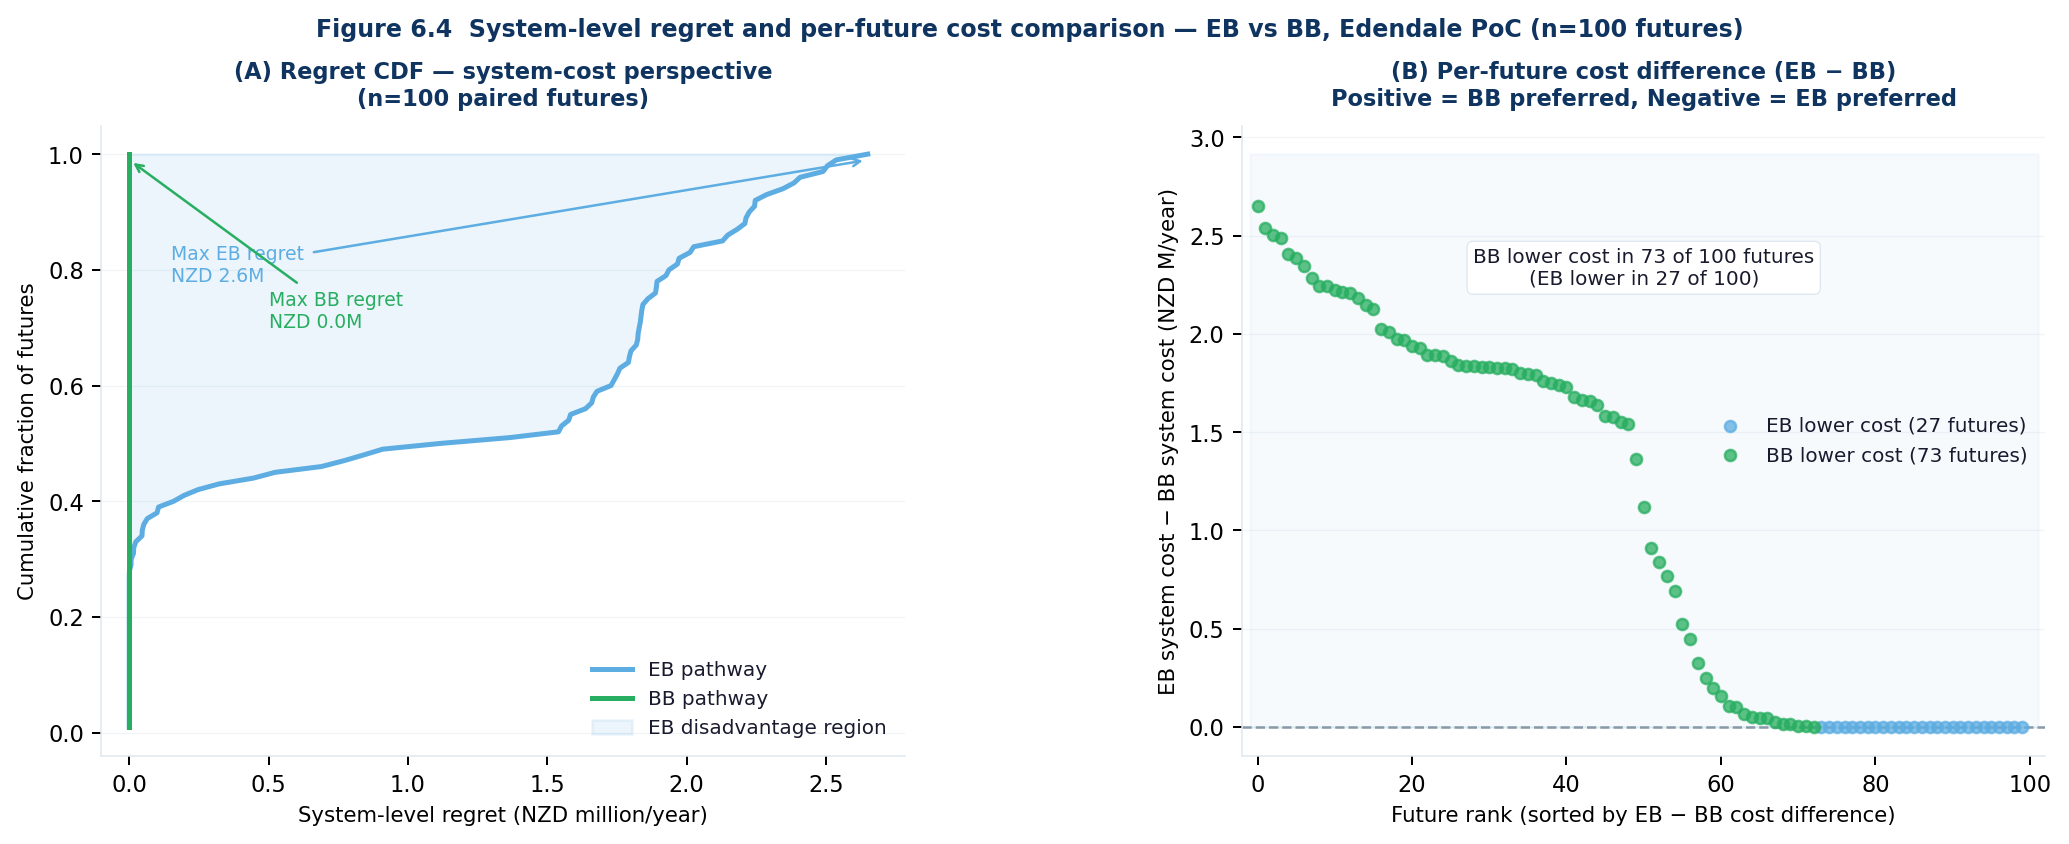
In 93 of 100 futures, the system-perspective total cost (site operating cost plus annualised upgrade cost) is lower for BB than for EB. The mean annualised upgrade cost for EB is NZD 6.73M/year; for BB it is NZD 5.77M/year. This divergence reflects the infrastructure-conditional cost penalty of EB’s higher peak demand, which exceeds BB’s by 38 MW at the 95th percentile. The private cost advantage of BB (NZD 14.2M/year lower site cost) is reinforced, not reversed, by the system-level perspective. Both dimensions of the comparison favour BB under current conditions.
Finding 4: Artefact traceability. Every result in Findings 1 through 3 is traceable through the artefact chain: from the DecisionSummaryArtefact through the RDM summaries, the ResultArtefacts, the incremental electricity traces, and the DemandPacks, back to the generating run configurations and the SignalsPack files with their SHA256-verified integrity. No finding depends on an ungovernened calculation or an undeclared assumption.
Finding 5: Progressive-refinement self-direction. The regret sensitivity diagnostics identify the headroom multiplier and the upgrade capex multiplier as the primary drivers of the EB/BB cost difference across the ensemble. The ETS price multiplier becomes decisive only in futures where BB’s residual biomass combustion emissions (1,610 tCO₂/year) carry a material carbon cost — which at current ETS price levels (NZD 60–90/tCO₂) represents NZD 97,000–145,000/year, too small to reverse the pathway comparison. A significantly higher ETS trajectory would be needed before the carbon-cost dimension materially favoured EB.
31.10 §6.10 What the PoC Does Not Establish and the Refinement Roadmap
The proof of concept does not establish four things, and stating these clearly is as important as stating what it does establish.
It does not establish that the 2035_BB pathway is the preferred choice at the Edendale facility. The analysis demonstrates that the BB pathway achieves a higher satisficing rate at the reference threshold under the current stylised assessment. It does not account for the strategic, operational, and supply chain considerations that a full investment decision would require: the management complexity of biomass logistics, the carbon accounting risks under a potentially evolving ETS biomass treatment, the Fonterra group’s overall pathway portfolio, or the corporate sustainability reporting environment’s assessment of what constitutes credible decarbonisation. The framework provides a decision-relevant comparison, not a planning recommendation.
It does not establish that the 24-of-100 binding-headroom finding represents the actual probability of a GXP constraint at the Edendale GXP. The headroom multiplier range in the FutureArtefact ensemble is calibrated to the plausible range described in the RETA assessment and the Module 5 documentation. It is not a probability distribution, and the 24/100 ratio is a satisficing count across a structured exploration, not a frequentist probability estimate. Its meaning is: under this range of conditions, this fraction of the conditions explored produces a binding hourly headroom constraint.
It does not establish that the infrastructure cost estimates in the upgrade menu are reliable engineering estimates for the specific Southland transmission context. They are screening-level estimates drawn from published indicative upgrade cost ranges. A genuine investment decision would require a Transpower or PowerNet connection assessment with site-specific engineering and commercial terms.
It does not establish that the one-pass coupling architecture produces the same pathway preference ranking as a full iterative coupling. The declared limitation in §6.1 means that the site cost estimates in grid-exceedance futures are computed without the upgrade cost adder affecting the dispatch optimisation. A full iterative coupling might produce different dispatch quantities in those futures as the site operator responds to the modified effective tariff.
The refinement roadmap. Four development priorities would address these four limitations in order of decision-relevance. The first priority is a higher-fidelity regional module, replacing the stylised screening with a PyPSA-based assessment or its ML surrogate, as specified in SM-6.6-E. This would directly address the third and fourth limitations and would substantially improve the confidence of the headroom assessment. The second priority is iterative coupling through a two-pass architecture in which the upgrade cost adder from the regional assessment is passed back to the site dispatch module as a tariff input for a second dispatch run. This would address the fourth limitation and close the gap between the one-pass assessment and the system-level regret derivation of SM-4.4-A. The third priority is measured DemandPack calibration: replacing the synthetic profiles with measured EMS data from the Edendale facility would address the second declared limitation and improve the temporal fidelity of the GXP peak demand assessment. The fourth priority is ensemble expansion to 500 or 1,000 futures using a trained ML surrogate of the regional module, making statistically meaningful PRIM-based scenario discovery and vulnerability mapping feasible with the methods specified in SM-2.4-A.